In brief:
After some remarks from prof Verreault and some own findings I have severely reinforced the way the TopUnit is mounted to the attic beam.
After this the amount of ellipticity is roughly halved. The more-or-less sine shape of the minor axis has become more irregular.
The Analisys Program has undergone a major rework, it now also produces graphs as function of the precession Amgle, even in polar form.
In these graphs we can see that some of the irregularities in the minor axis behaviour correlate quite well across succesive foucault periods.
In another experiment -underway- I study the effects of rotating the TopUnit in an attempt to localize causes of asymmetry in the system.
Some pictures are available now (2025-08-14)
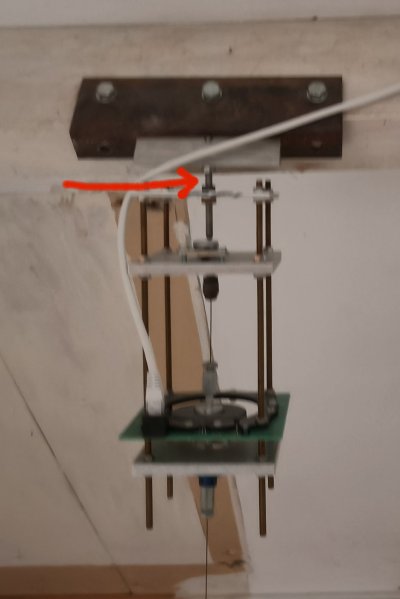
Fig 1 shows the old situation. Unfortunately a bit unsharp.
The red arrow points to the culprit. The lower end of that M6 rod does nothing, and is not touching the plate with the proxxon clamp.
That lower end is not completely visible here, because there is a small water level in the way. That has been removed now.
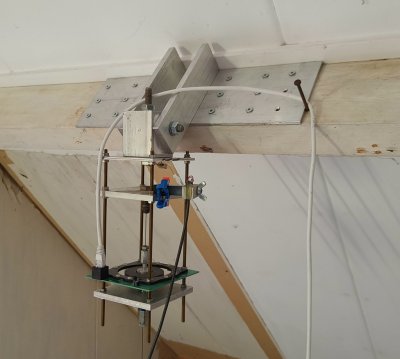
Fig 2. shows the new situation.
The plate where the M6 was is now coupled with M10 to a massive block of aluminium which in turn is fixed ridgidly to the wooden beam.
The blue clamp holds a laser pointer directed to the floor 4.5 m below. In the old situation the laserspot moved ca. 10 mm. Now no movement can be seen with the naked eye.
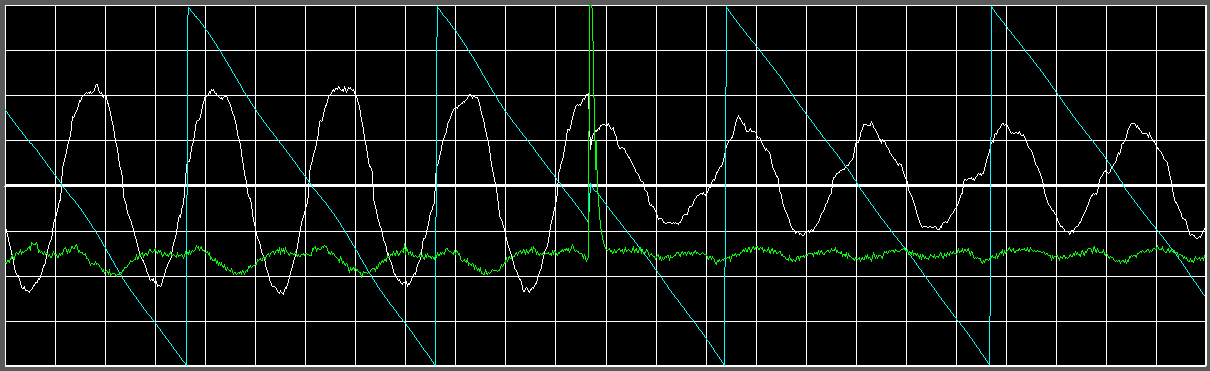
Fig 3. Data from july 5, 6, 7, followed by data from august 5, 6, 7 show the effect of reinforcing the top mount.
White: Ellipse minor axis, Vertcal scale ca. 11 mm / div.
Blue: Precession Angle, from +180 (W) over 90 (N) to 0 (E), then -90 (S) to -180 (W).
Green: Precession Velocity. First derivative of the blue line.
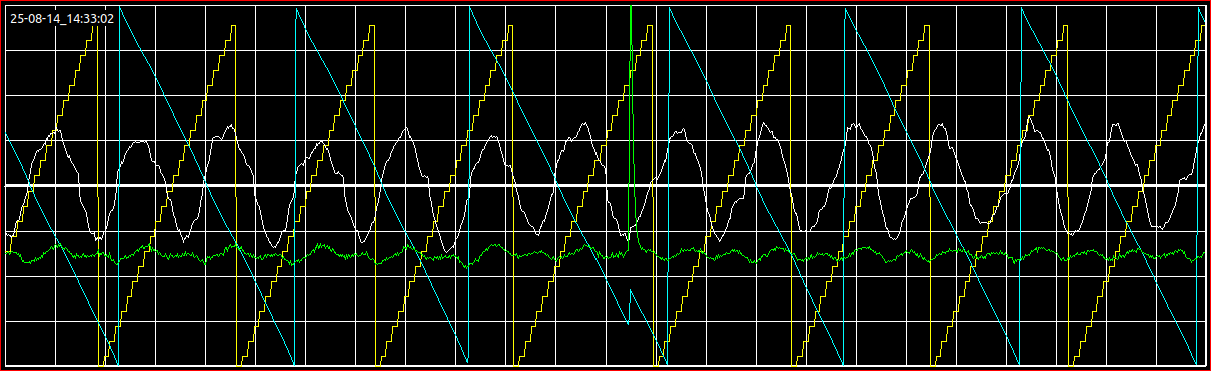
Fig 4. Time diagram of 9 days, where halfway the Topunit was rotated 40 degrees.
Data from july 29 to august 6. On august 2 around 20:00 (mid graph) the topunit was rotated 38 degrees CW.
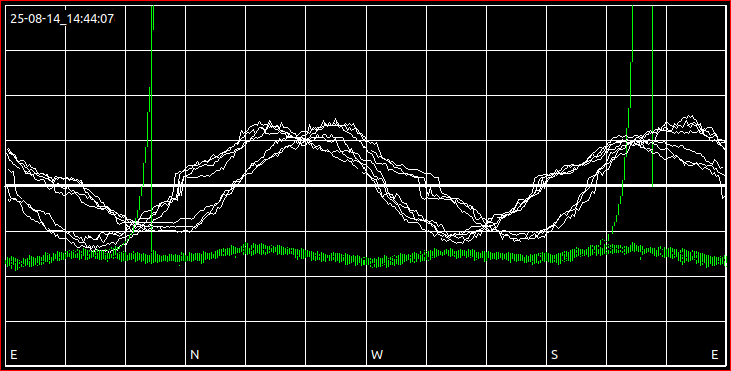
Fig 5. The same data as in fig 4. plotted against the Precession Angle.
Horizontal scale is 30 deg / div. Vertical scale is identical to fig 4, (11 mm / div for the minor axis.)
Clearly the phase difference due to the rotation is visible. Although, here it is slightly smaller than 30 degrees, while the rotation of the top unit is 39 degrees, verified in the angle values in the logfile. This asks for an explanation.
Certainly several "irregularities" show a strong correlation.
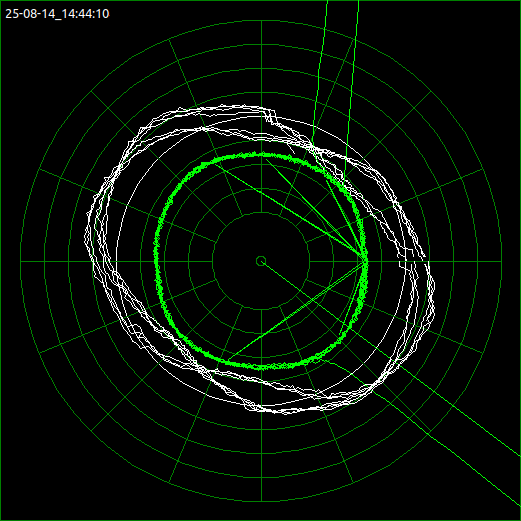
Fig 5. The same data as in fig 4, but now on a polar plot.
The inner circle of the grid represents the bottom line of fig 4, The outer circle represents the top.
Halfway the white centerline is drawn, representing zero for the minor axis amplitude.
The graph has the normal compass orientation, but related to the the top unit, NOT to the geographical NSEW.
Please ignore the fancy straight lines, these are artefacts from constructing the graph which I have not yet under control.